How Does a Smart Electricity Meter Work?
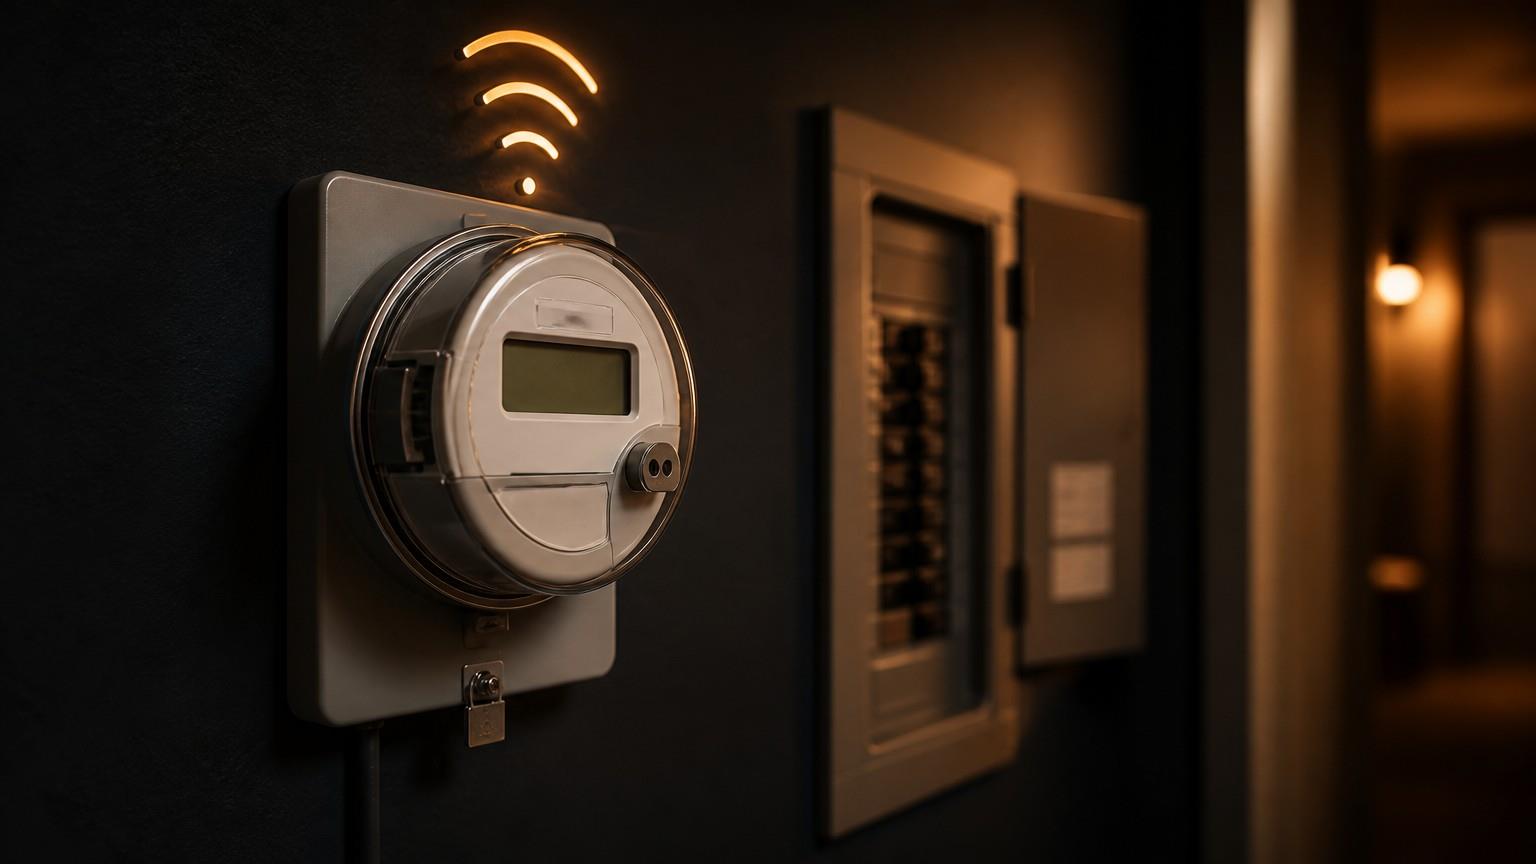
Energy bills can feel mysterious: you get a total each month, but not a clear explanation of when you used power, what drove the spikes, or how to fix them. That’s exactly what modern energy monitoring solves—and a smart electricity meter is the foundation. In plain terms, a smart meter measures your electricity use in near real time, securely sends readings to your utility, and can also feed insights into your smart home energy and home energy management tools so you can make faster, smarter decisions.
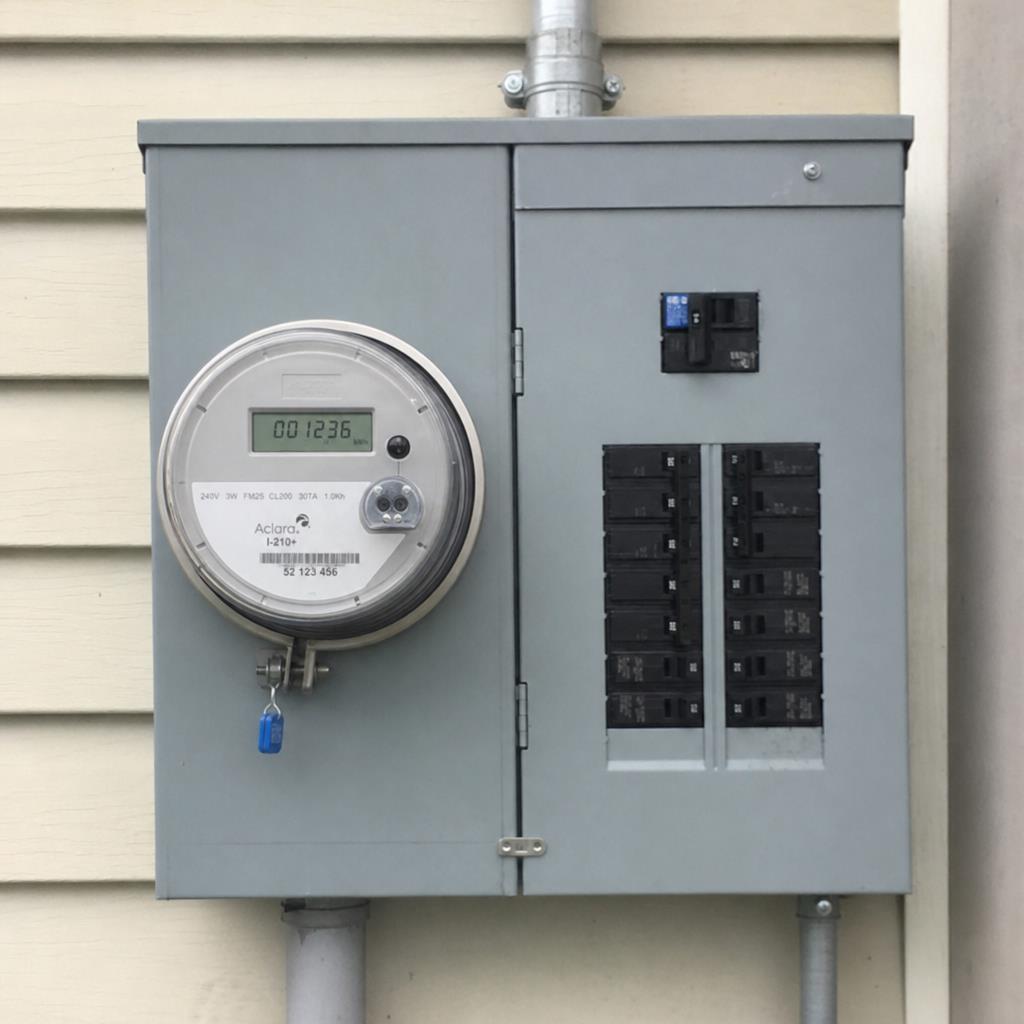
What a smart electricity meter is (and what it isn’t)
A smart energy meter replaces (or upgrades) a traditional “spin-dial” or basic digital meter. It records energy use (kWh) in small time intervals and communicates those readings automatically.
It’s not the same thing as:
- A whole house power monitor you install inside your breaker panel for circuit-level detail
- A home electricity usage tracker smart plug on a single appliance
- A “real-time” gadget that always shows device-by-device usage (smart meters usually don’t go that deep by themselves)
That said, smart meter data can pair with other devices to create a more complete best home energy management system.
How does a smart electricity meter work? (Step-by-step)
At a high level, it does four jobs: measure → timestamp → store → transmit.
1) It measures voltage and current
Inside the meter are sensors that sample:
- Voltage (how “strong” the electrical push is)
- Current (how much electricity is flowing)
From these, the meter calculates real power (watts), then totals it into energy over time (kilowatt-hours). This is the same unit your bill is based on.
2) It calculates kWh in time intervals
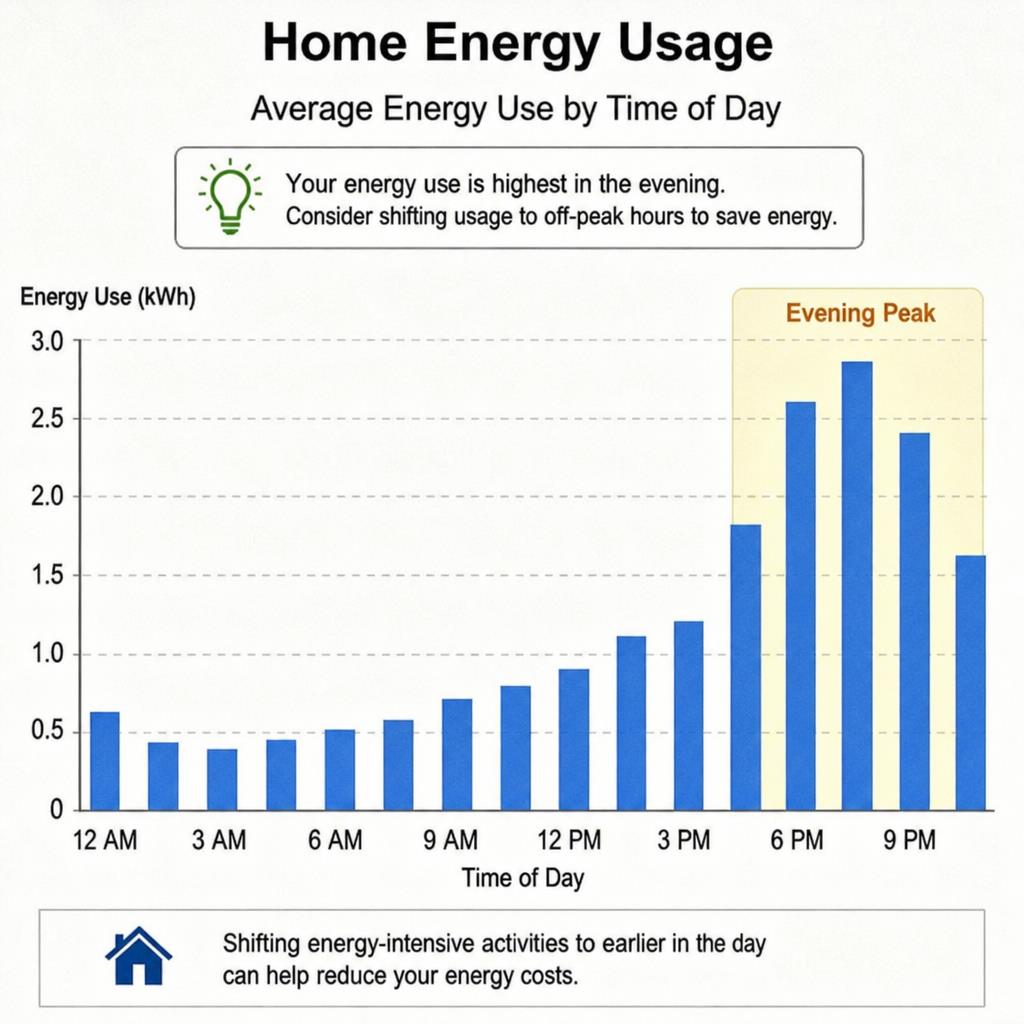
Instead of one monthly snapshot, smart meters record usage in intervals such as 15, 30, or 60 minutes (depends on the utility). That time-series detail is what unlocks smart meter data analysis—spotting patterns like “evening peaks” or “always-on” baseload.
3) It stores readings and event logs
Smart meters typically store:
- Interval kWh
- Voltage events (sags/swells)
- Outage/restoration flags
- Tamper detection signals
Utilities use these logs for billing accuracy, reliability, and grid operations.
4) It communicates readings to the utility
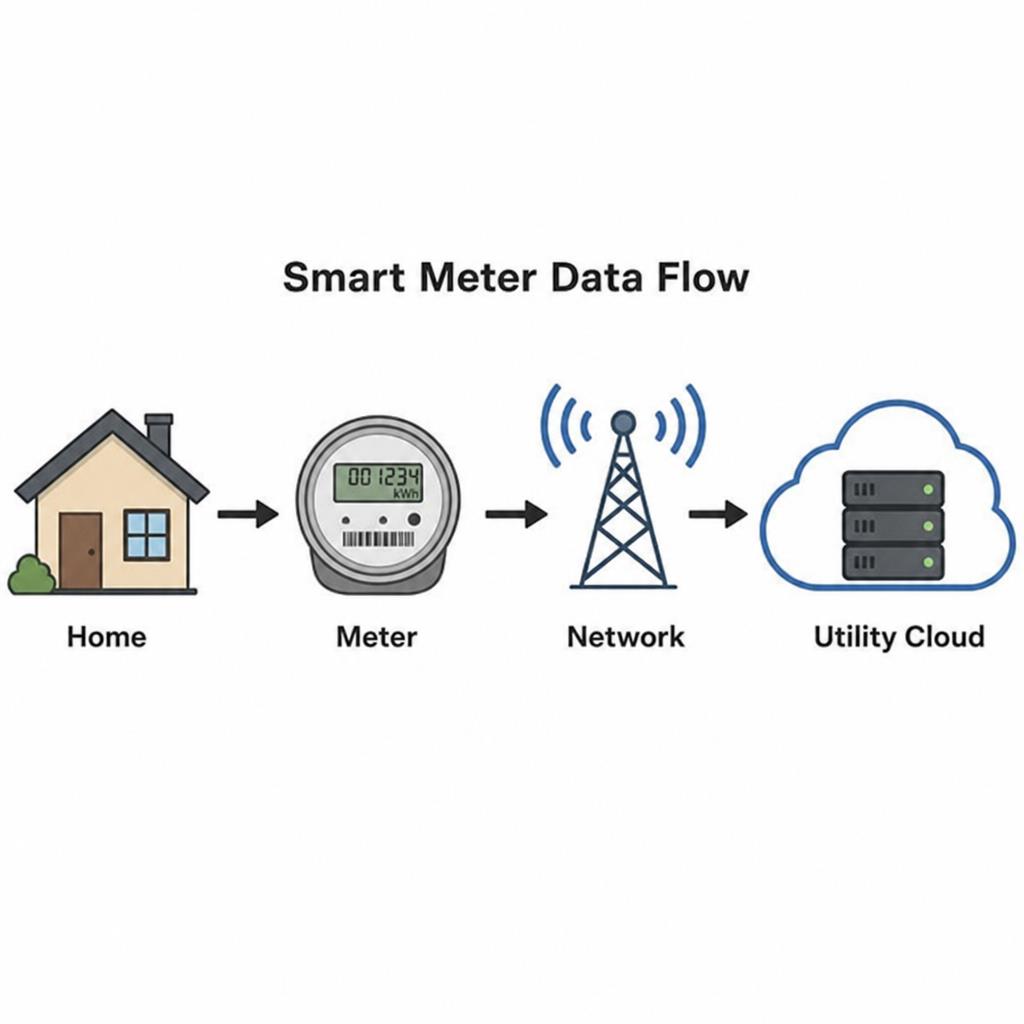
This is the biggest difference from old meters. Smart meters can transmit data via:
- RF mesh radio networks (meters relay data to each other and to collectors)
- Cellular modems (common in rural areas or special deployments)
- Power line communication (PLC) (data over power lines in some regions)
In some contexts, you’ll see meters described as an iot based smart energy meter because they behave like connected sensing devices. In commercial and research contexts, you may also encounter terms like cloud-based iot smart energy meter, where readings are pushed to a cloud platform for dashboards, alerts, and reporting.
Smart meters and smart grid technology: why utilities install them
Smart meters are a core component of smart grid technology. With better visibility into demand, utilities can:
- Restore outages faster (and sometimes detect them automatically)
- Plan upgrades where capacity is tight
- Support distributed energy (solar, batteries, EV charging)
- Offer utility time-of-use rates that reward off-peak usage
If you’re on time-based pricing, your cost isn’t just “how many kWh,” but “how many kWh at which time.” That’s why interval data is so valuable when learning how to reduce power bill.
What you can actually see: apps, portals, and real-time views
Many utilities provide a dashboard; some also offer a real-time power consumption app experience (or near-real-time with a short delay). Depending on your utility, you may see:
- Daily/hourly usage graphs
- Peak usage windows
- Estimated bill-to-date
- Comparisons to similar homes
This is where how to track electricity usage becomes practical: you’re no longer guessing.
Example: estimating costs with a kilowatt-hour cost calculator
A simple kilowatt-hour cost calculator idea:
- Device wattage × hours used ÷ 1000 = kWh
- kWh × your rate = cost
If your rate is time-of-use, apply the appropriate rate for the time window.
“What uses most electricity at home?” Use smart meter patterns to find out
Smart meter interval data can reveal when consumption spikes, helping you infer what caused it. Typical high-usage categories include:
- HVAC (heating/cooling)
- Water heating
- EV charging
- Pool pumps
- Dryers/ovens
- Always-on loads (routers, set-top boxes, old fridges)
When you ask what uses most electricity at home, the best approach is to combine:
- Smart meter interval charts (timing + magnitude)
- Targeted checks with smart plugs or monitors (device-level proof)
This is also how you identify appliance energy hogs without buying sensors for everything.
Detect energy vampires in house (the “always-on” problem)
Many homes have a steady baseline load—even overnight. That’s where you detect energy vampires in house:
- Look at usage from ~12am–5am for several days
- If the baseline seems high, unplug/test items in blocks (entertainment center, garage, office)
- Replace or retire offenders (older freezers, dehumidifiers, or misbehaving HVAC fans)
Smart meter data alone won’t tell you which device is the vampire, but it tells you whether you have one and when it’s active—then you confirm with targeted testing.
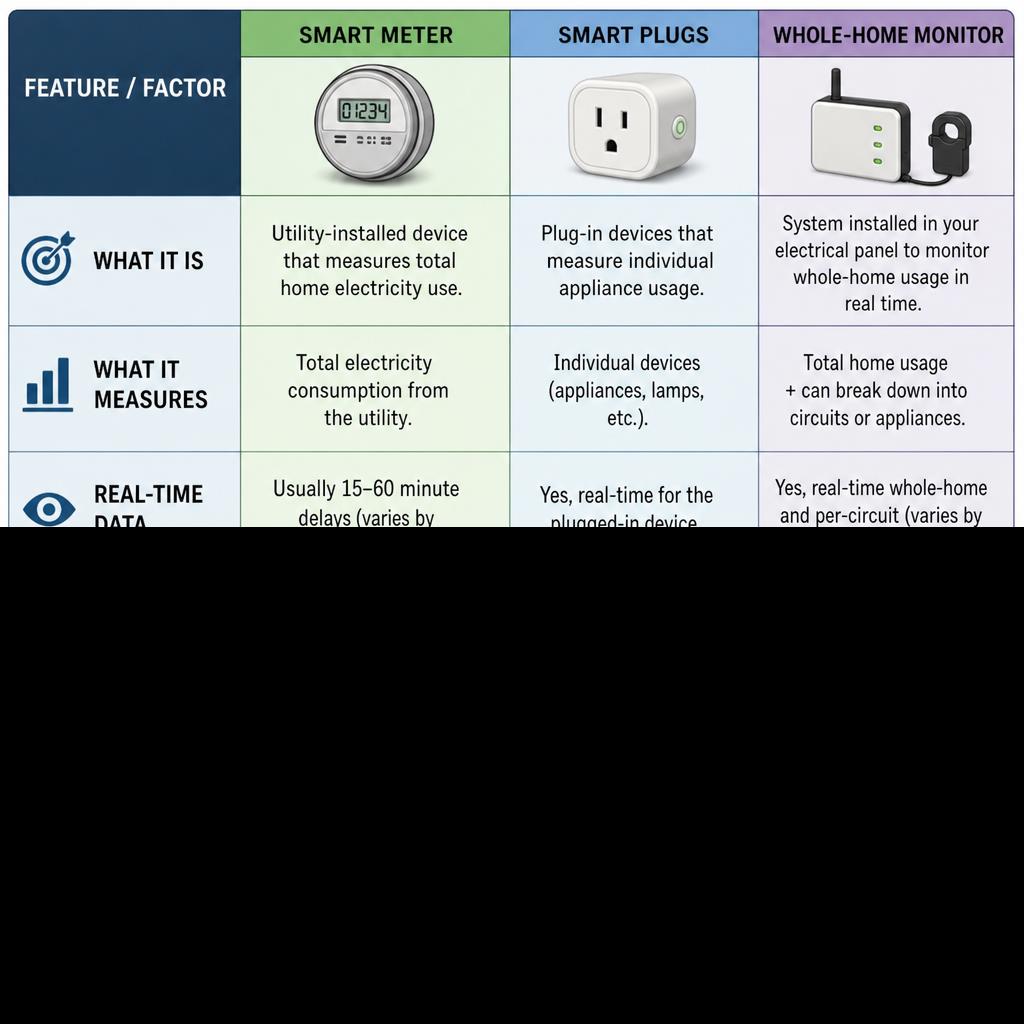
Smart plugs vs power monitors vs smart meters: what’s best?
A quick decision guide:
Smart meter (utility-provided)
Best for:
- Whole-home usage and billing insight
- Time-of-use optimization
Limits:
- Usually not appliance-level detail
Smart plugs (outlet-level)
Best for:
- Testing a single device (TV, fridge, dehumidifier)
- Quick wins and automation
This is the classic smart plugs vs power monitors tradeoff: plugs are cheap and specific but don’t cover hardwired loads.
Whole house power monitor (panel-installed)
Best for:
- High-resolution total usage + often per-circuit or “device signatures”
- load monitoring for circuits
- A robust home electricity usage tracker setup
Limits:
- Hardware cost + installation complexity
If your goal is a best home energy management system, many households combine all three: smart meter for billing/time-of-use, panel monitor for detail, and smart plugs for plug-in devices.
Under the hood: common “smart meter” architectures (IoT + protocols)
In DIY, lab, and product-development communities, you may see variants such as:
- i2c smart energy meter designs, where a metering IC communicates with a microcontroller over I²C (common in prototyping)
- A dashboarded cloud-based iot smart energy meter that streams data to cloud storage and analytics
- Cellular projects described as GSM-based
GSM-based meters (what those “research reports” usually mean)
You might come across documents like a gsm based smart energy meter research report or a gsm based smart energy meter reading project report. These typically describe:
- A meter or sensor reading energy data
- A GSM module transmitting readings via cellular (SMS/GPRS/LTE depending on design)
- A server/app storing and displaying usage
In the real world, utilities may use cellular too—but many large deployments rely on RF mesh networks for cost and coverage reasons.
Smart meter data analysis: turning graphs into savings
To convert data into action, try this weekly checklist:
- Find your baseline
- Overnight minimum usage = “always-on” load.
- Identify peak windows
- Note the top 2–3 hours of the day.
- Match peaks to behaviors
- Cooking? Laundry? EV? HVAC recovery?
- Adjust timing
- Shift flexible loads off-peak (dishwasher, laundry, EV) if on utility time-of-use rates.
- Confirm the result
- Compare week-over-week usage and cost.
Practical tips: how to reduce power bill with smart-meter-driven habits
Use your interval data to prioritize the highest-impact changes:
- HVAC: tighten setpoints, clean filters, use smart scheduling; avoid big “recovery” ramps during peak rates.
- Water heating: reduce temperature slightly, insulate pipes, consider heat-pump water heating long term.
- Laundry: run dryer less, use cold wash, run off-peak.
- Cooking: batch cook; use microwave/air fryer for small loads.
- Always-on devices: cut the baseline—this is often the fastest “invisible” win.
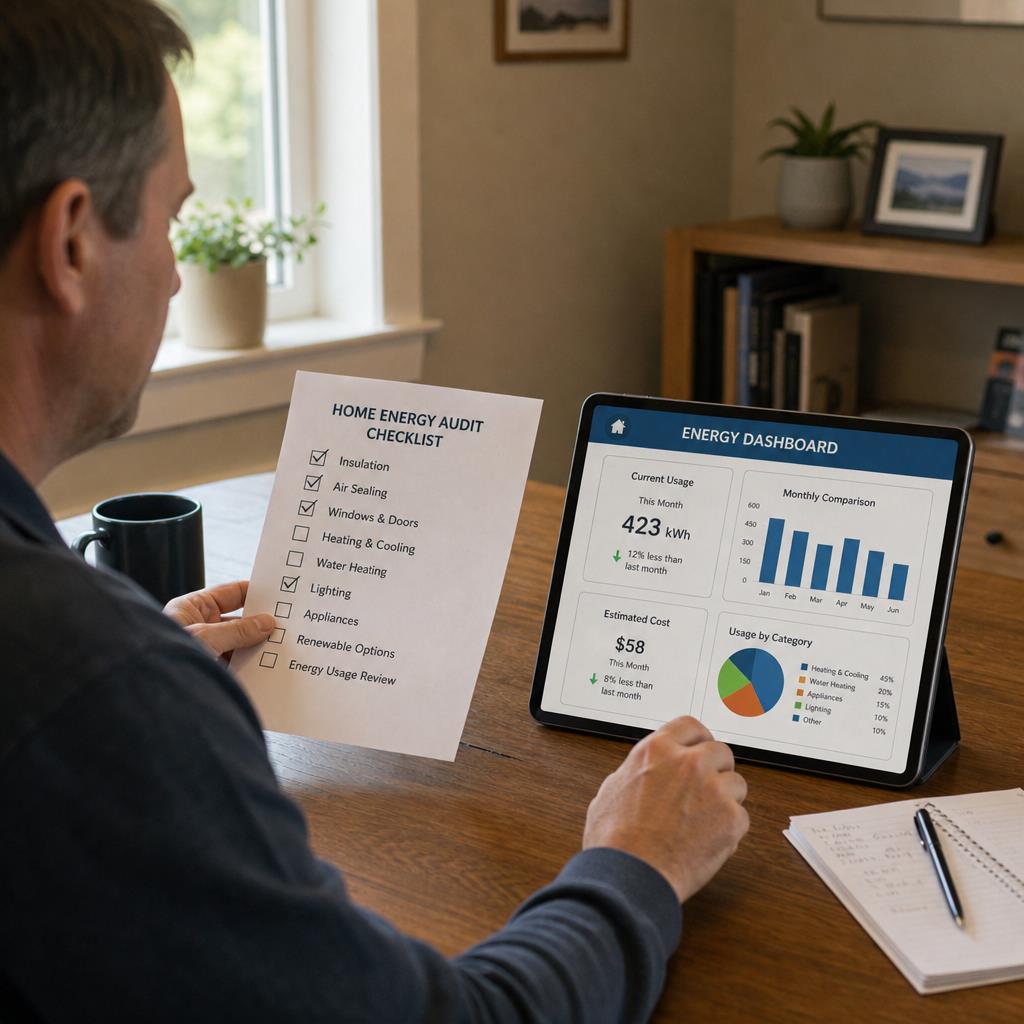
If you’re unsure where to start, do a quick residential energy audit checklist:
- Check insulation/air leaks (attic doors, ducts, weatherstrips)
- Inspect HVAC age, maintenance, and thermostat schedule
- Review water heater settings and leaks
- Identify old refrigerators/freezers and always-on entertainment gear
- Compare usage on “normal days” vs “away days”
A note on utility programs and examples (including Australia)
Smart meter features and portals vary by provider and region. If you’ve searched terms like energy australia smart meter, you’ve probably noticed that utilities often bundle smart meters with specific plans, rollout programs, and data-access methods. The principle is the same everywhere: interval readings enable better billing accuracy, better outage response, and more consumer visibility—though the app experience and update frequency differ.
Key takeaway
A smart electricity meter works by measuring voltage/current, converting that into kWh over short intervals, storing those readings, and securely transmitting them to support billing and grid operations. For homeowners, the real value is visibility: with energy monitoring, you can spot peaks, optimize around utility time-of-use rates, run a simple kilowatt-hour cost calculator, and combine smart meter insights with smart plugs or a whole house power monitor to identify appliance energy hogs and detect energy vampires in house—turning “mystery bills” into a plan you can act on.
Looking for the meter itself? Yomin Electric manufactures smart energy meters with interval data, RS485/MODBUS communication, and optional IoT/cloud integration — view the smart meter range or ask our engineers.
Need Help Choosing the Right Product?
Our engineers can recommend the exact model, rating and configuration for your project. Tell us your requirements and get a factory-direct quote within 24 hours.